Changes in Hospital Outpatient Charges: A National Analysis of CPT-Based Service Categories, 2024–2026

Introduction
Public concern over healthcare costs, particularly hospital prices, continues to intensify. Hospital outpatient services represent an important component of healthcare spending, and the prices established by hospitals for these services can have significant implications for patients, employers, and commercial health insurers.
Although considerable attention has been directed toward differences in prices among hospitals, less attention has been given to how hospital charges change over time and whether those increases vary across categories of outpatient services.
This study examines national hospital outpatient charge trends from 2024 through 2026 using CPT-coded services grouped into categories based on the Berenson-Eggers Type of Service (BETOS) classification system. The analysis identifies service categories experiencing the largest increases in reported charges and evaluates the variation in charge growth across major types of outpatient services.
Data and Methodology
The analysis uses data from the Chronic Conditions Warehouse (CCW) Virtual Research Data Center (VRDC) that were classified into five major service groups: evaluation and management, procedures, imaging, tests, and therapies.
Average charges are reported for 2024, 2025, and 2026. Charges are case-mix adjusted using Medicare’s APC relative weight or Medicare’s fee schedule for areas such as lab and therapy. Percentage changes are calculated by comparing the reported average charges in 2026 with those in 2024.
Overall Changes in Hospital Outpatient Charges
The table below presents changes in average hospital charges across the five major service categories and the areas that comprised them.
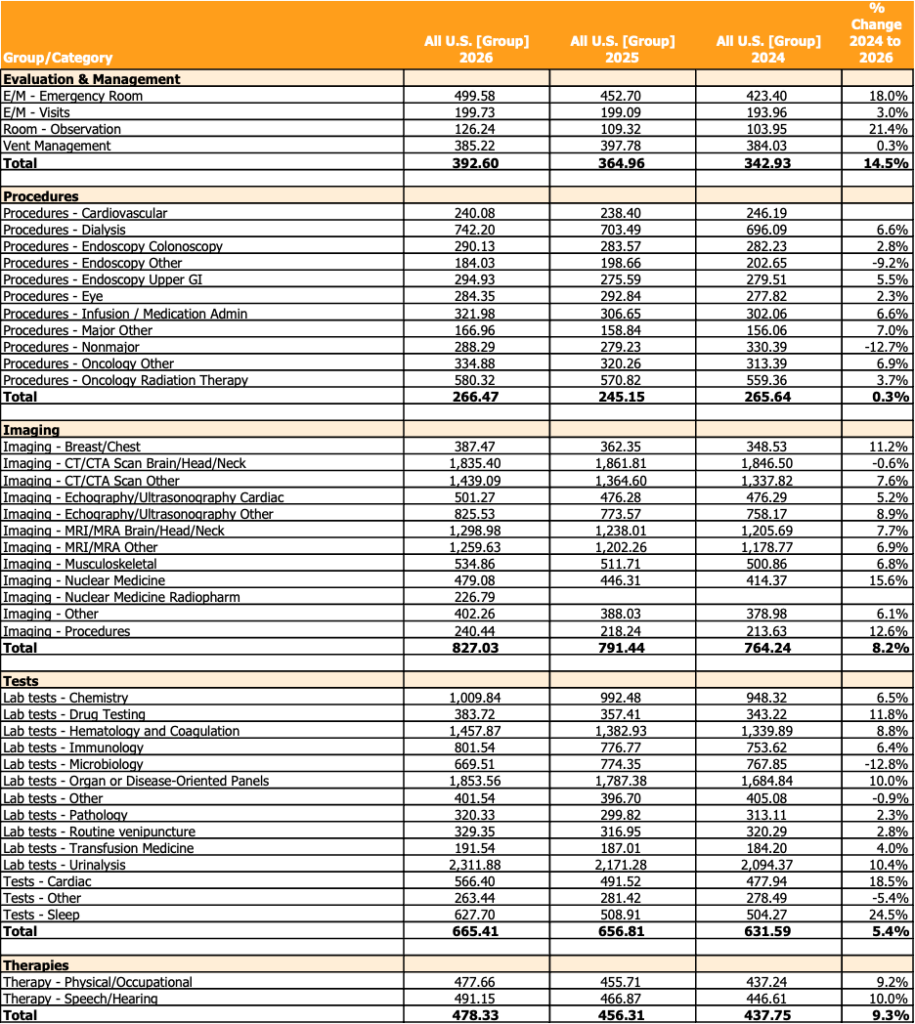
Evaluation and management services experienced the largest increase among the five major groups, with average charges increasing 14.5%. Therapy services experienced the second-largest increase at 9.3%, followed by imaging at 8.2%. In contrast, average charges for procedures increased only 0.3% over the two-year period. These differences suggest that changes in hospital charges have not been uniform across outpatient service categories.
Emergency Department Charges Have Increased Substantially
One of the most significant findings is the increase in charges associated with emergency department services. Average charges for emergency room evaluation and management services increased from $423.40 in 2024 to $499.58 in 2026, an increase of 18.0%. The rate of increase was higher in lower complexity ED visits, e.g., levels 1 through 3.
Observation services also experienced a substantial increase of 21.4%.
Imaging Services Show Significant Variation
Average charges for imaging services increased 8.2% between 2024 and 2026. However, substantial differences were observed across imaging categories. Nuclear medicine charges increased 15.6%, while charges for imaging procedures increased 12.6%. Breast and chest imaging increased 11.2%. Other imaging categories experienced more moderate increases, generally between 5% and 9%. One notable exception was CT/CTA imaging of the brain, head, and neck, where average charges declined slightly by 0.6%. These results suggest that the rate of charge growth varies significantly even within a single major service category.
Procedure Charges Have Remained Relatively Stable
In contrast to evaluation and management services, average charges for procedures increased only 0.3% between 2024 and 2026. However, this overall result conceals important differences among procedure categories.
Charges for major other procedures increased 7.0%, oncology-related procedures increased 6.9%, and dialysis procedures increased 6.6%. Conversely, average charges for non-major procedures declined 12.7%, while charges for other endoscopic procedures declined 9.2%. These findings suggest that the composition of services within the procedures category may be an important factor in understanding the relatively small overall increase.
Laboratory and Diagnostic Testing
Average charges for tests increased 5.4% between 2024 and 2026. The largest increase occurred in sleep testing, where average charges rose 24.5%. Cardiac testing charges increased 18.5%, while drug testing increased 11.8%, urinalysis increased 10.4%, and organ- or disease-oriented laboratory panels increased 10.0%. In contrast, microbiology charges declined 12.8%. The substantial variation across testing categories reinforces the importance of evaluating individual service groups rather than relying exclusively on overall hospital charge trends.
Discussion and Implications
The findings suggest three important conclusions.
First, hospital charge increases have varied substantially across outpatient service categories. Evaluation and management services, particularly emergency department and observation services, have experienced relatively large increases, while average procedure charges have remained comparatively stable.
Second, the variation within major categories suggests that broad measures of hospital price inflation may obscure important differences in the pricing of specific services.
Third, gross charges and actual payments must be distinguished. Although hospital charges may influence commercial reimbursement in contracts based on a percentage of charges, increases in gross charges do not necessarily result in equivalent increases in payments received by hospitals.
Conclusion
National hospital outpatient charge data for 2024 through 2026 reveal substantial differences in charge growth across categories of medical services. The most significant increases occurred in evaluation and management services, particularly emergency department and observation services. Imaging, therapy, and diagnostic testing categories also experienced notable increases. By contrast, average charges for procedures remained relatively stable, although important differences were observed among individual procedure categories. These findings suggest that evaluating hospital charge growth at the level of specific services provides a more informative perspective than relying exclusively on aggregate measures of hospital price inflation.
Understanding these differences is particularly important for patients, employers, insurers, and policymakers seeking to evaluate hospital pricing practices and identify services experiencing unusually rapid price increases. It also provides useful benchmarking for hospitals as they assess their own pricing policies.
Have thoughts or questions?
Related