Hospital Quality Improvements: Added Cost or Cost Savers

What is the relationship between hospital costs CMS quality rating?
At the time of this writing Medicare has provided incentive payments for improvements in hospital inpatient quality to approximately 3,000 acute care hospitals through its Value Based Purchasing (VBP) program. A number of commercial payers have also introduced VBP programs for payment to their participating hospitals. The unanswered question is do improvements in quality come at a cost, or do they actually reduce cost. While there have been many prior studies, those studies varied in their definition of both cost and quality. Some studies reference cost to the patient while others review cost to the hospital. The studies also used different metrics for defining quality.
In this short blog, we will take a look at the relationship between costs incurred by the hospital and the quality rating provided by CMS in Hospital Compare at their website. Hospitals receive an overall star rating from 1 to5. The overall star rating includes a variety of the more than 100 measures CMS publicly reports, divided into 5 measure groups or categories: Mortality, Safety of Care, Readmission, Patient Experience, and Timely & Effective Care. We have pulled the 2021-star ratings reported for short term acute care hospitals. It should be noted that much of this data relied upon three years of reporting 2016 to 2019. We next pulled cost metrics for those hospitals from 2020 Medicare cost reports. Merging those two data bases provided us with 2,762 hospitals. The quality and cost metrics are shown below.
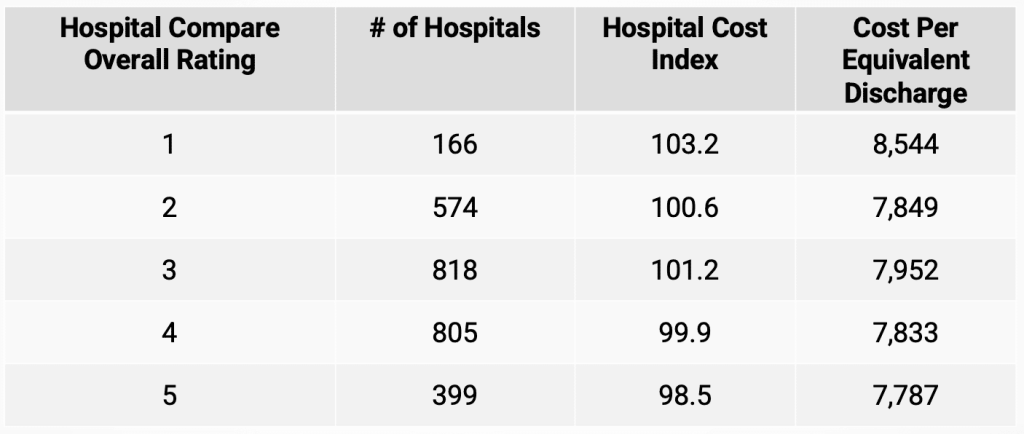
The table shows that there is a reduction in cost for hospitals with higher quality scores. For example, hospitals with the poorest star rating (1) had a median Hospital Cost Index (HCI) value of 103.2 which was 5 percent above the HCI value of 98.5 for hospitals with a 5-star quality score. The largest variance in the HCI values occurs when the quality score improves from 1 to 2. While cost reductions take place in other quality score changes the variance is much smaller.
The HCI is a metric that combines values for the average cost per discharge indexed to the US average and the average cost per outpatient visit which is also indexed to the US average. Both of these metrics are also adjusted for both case mix variation and cost of living differences.
We also included another metric for hospital cost, Cost per Equivalent Discharge (CPED), to further assess the relationship between quality and cost. The results were a mirror image of the variation observed when the HCI metric was used as the measure of hospital cost. Hospitals with the lowest quality rating had the highest CPED which was 9 percent above hospitals with 2-star rating. While variation between other quality scores showed reduced costs with higher quality scores, the variation was smaller.
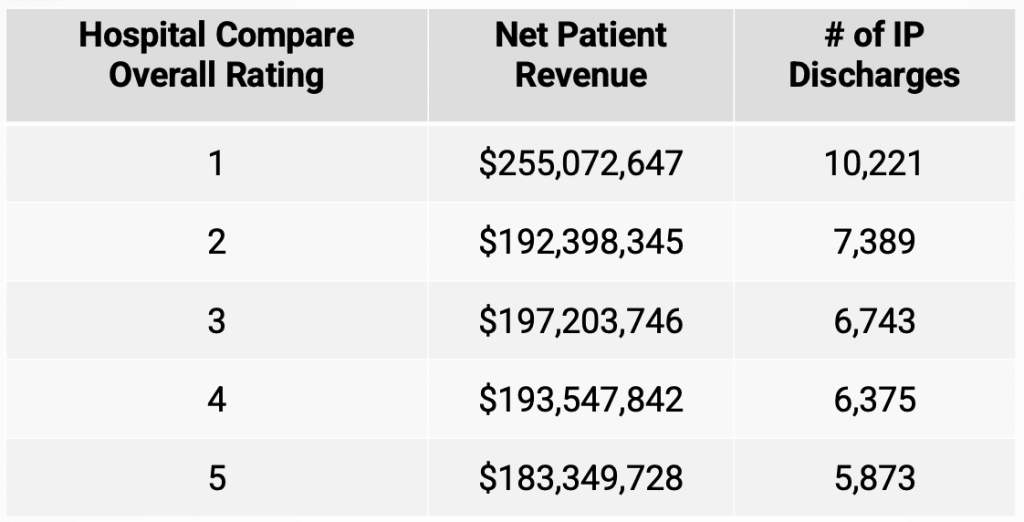
Given these results, the question that needs answered is why are costs higher for the lowest quality rated hospitals? The table below shows median net patient revenue and median number of inpatient discharges for each Hospital Compare star rating. The data suggests that the largest hospitals are more likely to have the lowest quality rating. Further, the data suggests that hospitals with higher volumes of inpatient discharges are more likely to have lower Hospital Compare quality ratings. When we ran a simple correlation between quality scores and either net patient revenue or inpatient discharges, we found that both were highly correlated, but inpatient discharges had a higher correlation coefficient (.64) compared to net patient revenue (.56).
While this is a preliminary analysis, there are several key findings. First, larger hospitals –especially those with high volumes of inpatient care-have lower Hospital Compare quality scores. Second, hospitals with the lowest Hospital Compare quality score do have higher levels of cost but variation is much less across the remaining 4 quality levels. One possible explanation for these findings might be a bias in the Hospital Compare quality scoring methodology. A higher percentage of the Hospital Compare quality score is related to inpatient procedures. If larger hospitals treat more severely ill patients, it is possible that the Hospital Compare quality score might not recognize severity of care variation. For example, would death rates for pneumonia patients be higher for larger referral hospitals who might be receiving more severely ill patients? If this is true, larger hospitals might have lower scores in this area.
Have questions about this or want to learn more? Let us know!
Have thoughts or questions?
Related