Insurance Firm Profits and Healthcare Costs, Where is the Blame?

Are Health Insurance Firms Putting Profits Over Patient Care?
There have been some advertisements on various media platforms suggesting that major health insurance firms are prioritizing profits over the health of patients. The website that contains more information is www.healthcomesfirst.org and is an initiative of Trinity Health. The primary focus of the commercials and the website is that hospitals are not being fairly reimbursed by major health insurance firms and are realizing inadequate levels of profitability while health insurance firms are making record profits. One claim is “in 2022, the top 6 health insurance companies made $41.5 billion”. We are not certain how the 6 firms were identified but decided to do our own assessment of the reasonableness of profitability for major health insurance companies. We identified the following 6 firms based upon their 2022 revenue.
- UnitedHealth Group (UNH) $324.1 billion
- Cigna Group (CI) $180.5 billion
- Elevance Health (ELV) $156.6 billion
- Centene Corp (CNC) $144.5 billion
- Humana (HUM) $92.9 billion
- Molina Healthcare (MOH) $32.0 billion
Noticeably absent in this list is CVS Healthcare which would include Aetna. In 2022, CVS reported $91.4 billion in revenue from their Healthcare Benefits segment, however identifying actual profitability in this segment was not possible and so they were not included in our final list.
The realization of profit in any business is not a crime, and in fact is a requirement for the continued viability of any business. This is true for both for-profit and non-profit organizations. The question is however whether that level of profit is reasonable. To answer this question, we examined values for two primary measures of profitability, Total Margin (TM) and Return on Equity (ROE). TM measures the amount of profit realized per dollar of revenue. Margin requirements vary across industries and even among firms within an industry because of differences in the level of capital intensity and financing patterns. Industries or firms with large investments in capital assets such as manufacturing need to realize higher margins to offset lower levels of revenue generation per dollar of investment. Ultimately, it is ROE (the ratio of net income to equity) that is the primary financial measure of performance for both for-profit and non-profit firms. Low ROE values in a for-profit firm will limit its ability to reward its suppliers of capital and to finance growth. In non-profit firms ROE values determine growth rates. For example, a non-profit hospital with a long-term average ROE of 5% will be limited to a 5% growth rate in assets which most likely would not be sufficient to meet its replacement cost needs given normal inflation and expected health care technology improvements.
The table below presents values for TM and ROE for each of the 6 health insurance firms for the years 2018 to 2022. There are some major differences in profits across the 6 firms with UNH reporting the highest levels for TM and the second highest levels of ROE, while ELV (Anthem) reported the second highest TM values, but their ROE average was below the 6-firm average. MOH might appear to be an enigma because their TM values were the second lowest, but their ROE values were the highest. The high ROE values in their case are the result of significant financial leverage (76% of their assets are financed with debt) and lower levels of capital intensity (MOH generated $2.60 of revenue for every dollar of investment in assets in 2022—while the value for UNH was 1.32 in 2022).
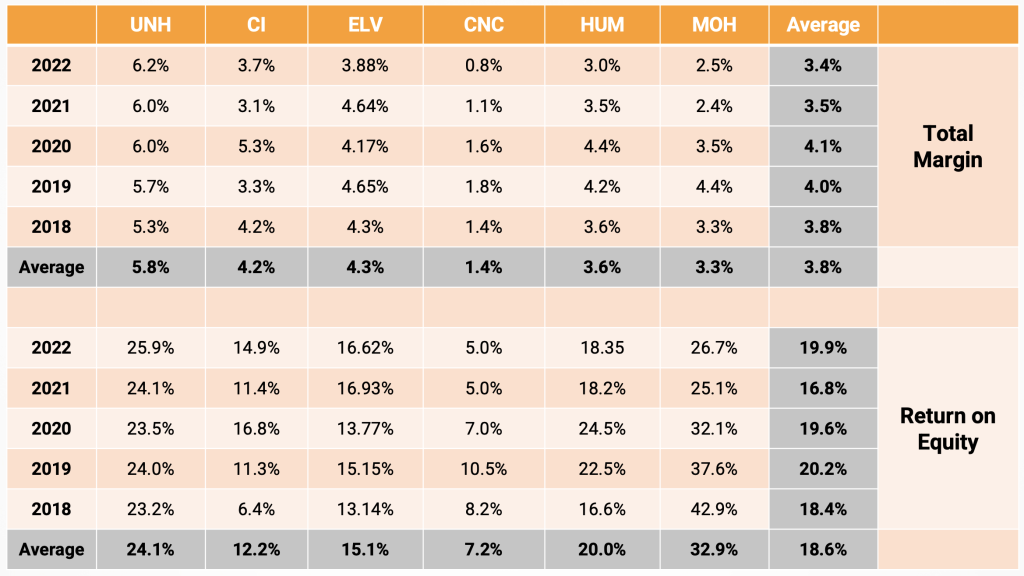
So, are the reported values of profitability reasonable? The average ROE across all industries as reported by New York University in January 2024 was 15.98% and the average net margin was 7.58%. Values for the 6 health insurance firms do not seem to be unreasonable and are close enough to industry averages that most people would not raise questions regarding their values. However, the “healthcomesfirst” web site and their ads are comparing health insurance firm levels of profit to hospital values. Presented below are the median values for TM and ROE for the hospital industry for the period 2018 to 2022. These values were computed from filed Medicare Cost Reports for all acute care hospitals.
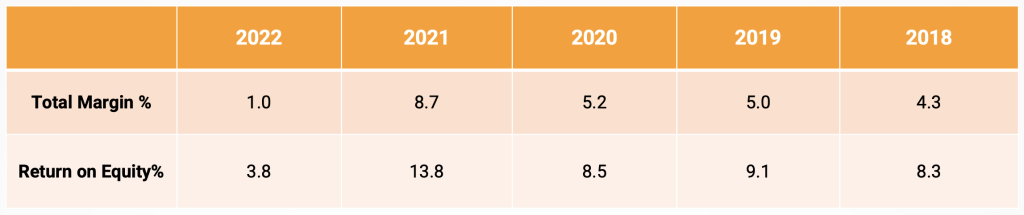
While values for 2023 are still not complete, there is significant decline 2022 for both TM and ROE. Most people would agree that the 2022 values are well below levels that are essential to maintain financial viability and any continuation or further decline will result in more hospital closures. So, what has been the cause for the significant decline in hospital profitability in 2022? Reviewing the data shows that the average rate of increase in cost per equivalent discharge in 2022 was 6.0% which was slightly below the 6.5% increase in the Consumer Price Index. The average rate of increase in net revenue per equivalent discharge was only 3.2%. While these are hospital industry medians, they do document the simple fact that when revenues increase at a rate less than costs, profit margins will decline. Since the increase in hospital costs is less than the overall increase in general inflation, it suggests that hospitals cannot be criticized for failure to control their costs. The actual increase in revenue however was well below the increase in general inflation and clearly demonstrates that revenue increases have not kept pace with inflationary changes.
Does this however imply that commercial health insurance plans are the primary culprit? There has been a number of recent hospital newsletter pieces documenting three major trends in managed care payers, especially managed Medicaid, and managed Medicare, which have contributed to the decline in hospital payment. Chief among these factors is the increasing frequency of denying claims. In the “healthcomesfirst” website Trinity Health states that they lost $120 million in denied claims. There is also some indication that managed care payers are slowing their payment of claims and increasing requirements for prior authorization.
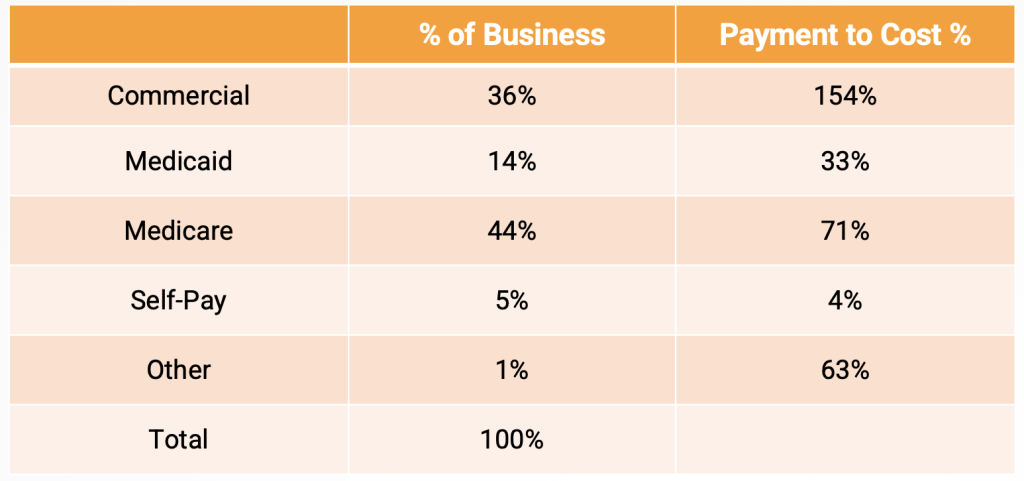
While we believe these changes are contributing factors, it must be understood that the primary cause of poor hospital profitability is linked to inadequate payment from major government payers. Pasted below is some data from one of our clients that shows the relationship of payment to cost for payer categories. While these values may not be representative of your hospital, we believe that the relative values are close to reality for many hospitals in the US. The actual relationship between Medicaid payment and “Medicaid allocated cost” taken from Worksheet S-10 for all US acute care hospitals in 2022 was 74% with state variation running from 38% to 142%. An AHA analysis published Jan. 10 shows that Medicare paid 82 cents for every dollar hospitals spent on care for Medicare patients in 2022 — the most recent year for which data is available.
What is the primary takeaway from all of this? First, we believe that most health insurance firms are not realizing excessive profits and are not the primary villain for low hospital profitability. Second, health insurance firms are making payments that are well above costs in most situations and are helping to subsidize inadequate governmental reimbursement. Finally, the real question is should health insurance firms be obligated to cover payment deficiencies by governmental programs? Historically, health insurance firms have subsidized government payment deficiencies and losses on self- pay patients, but their ability to continue this policy will become increasingly constrained as the percentage of commercial payers’ declines.
Have questions or want to know more? Contact us here!
Have thoughts or questions?
Related